- By gisresources
- April 13, 2014
- No Comments
The indices calculated from satellite imageries such as Normalized Difference Vegetation Index (NDVI), Normalized Difference Built Index (NDBI) and Normalized Difference Water Index (NDWI) have indices value ranges from -1 to 1.
This could be a very basic question for remote sensing and GIS professionals but still there are many beginners how would like to understand why above indices ranges from -1 to 1? The second question comes in mind is what does these indices value signifies?
Let first go through the Normalized Difference Vegetation Index (NDVI):
NDVI is a vegetation index to monitor the condition of vegetation or vegetation health. NDVI is the most commonly used vegetation index for monitoring vegetation globally. There are many other vegetation indices such as Enhanced Vegetation Index (EVI), Ratio Vegetation Index (RVI) and Perpendicular Vegetation Index (PVI) that takes into account the soil emissivity (one of the major limitations of NDVI).
Here, I am discussing only about NDVI. You may read about other vegetation indices from following link: http://goo.gl/xmbUWQ
Mathematically NDVI is calculated using the below formula:
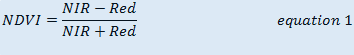
We know that chlorophyll content of vegetation absorb strongly the red wavelength of sunlight and reflect in near-infrared wavelengths.
Please have look at below figure. The figure shows the spectral response of healthy vegetation. In red band (620 – 750 nm) there is maximum absorption of sunlight and in near-infrared (750 to 1400 nm) maximum of sunlight is reflected back.

So, when energy is absorbed at red band its reflectance will be zero (ideally or in case of ice or water).
Now, in case of healthy vegetation.

But in the case dry crop or unhealthy vegetation the chlorophyll content is either very low or may be no chlorophyll in case of dry crop.
In below, the spectral curve of unhealthy vegetation shows that there is very less absorption of sunlight or more reflectance in red band (620 – 750 nm) rather in case of healthy vegetation. In near-infrared band ((750 to 1400 nm)) the reflectance is also very low as maximum of energy is being absorbed in NIR band.

So,
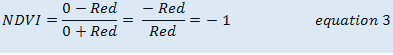
Now we can conclude, why NDVI value ranges from -1 to 1?
Now the second question: What is the significance of NDVI value from -1 to 1 in interpretation of NDVI images ?
Upon the classification of NDVI image in various ranges based on the NDVI value following significant information can be extracted from imagery.
- Barren rocks, sand, or snow show very low NDVI values (-0.1 to 0.1)
- Shurbs and grasslands or senescing crops – 0.2 to 0.5
- Dense vegetation or tropical rainforest – 0.6 to 0.9
- Deep water- -1
Normalized Difference Built-up Index (NDBI):
Normalized Difference Built-up Index (NDBI) is used to extract built-up features and have indices range from -1 to 1.

Let’s have a look on spectral curve of Built-Up and find out the solution why NDBI ranges from -1 to 1.

Use the above logic as of NDVI, to get the answer by your own.
Normalized Water Index (NDWI):
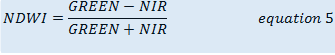
Normalized Water Index (NDWI) is an index to extract water bodies from satellite imagery. Following is the formula to derive NDBI;
The logic is same here for the reason of being NDWI indices value from -1 to 1.

The NDWI maximizes reflectance of water by using green band wavelengths and minimizes low reflectance of NIR by absorbing maximum of wavelength . As a result, water features are enhanced owing to having positive values and vegetation and soil are suppressed due to having zero or negative values
Read related article:


You must be logged in to post a comment.